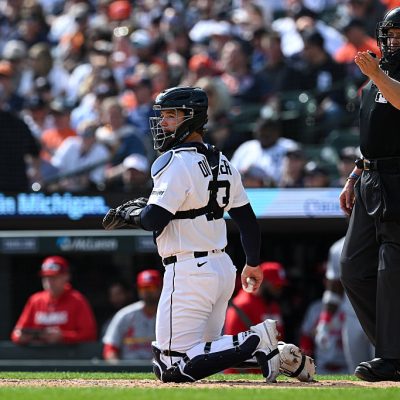
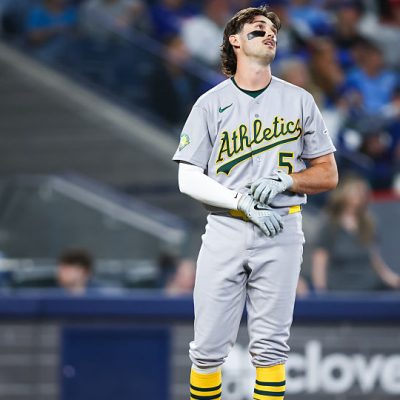
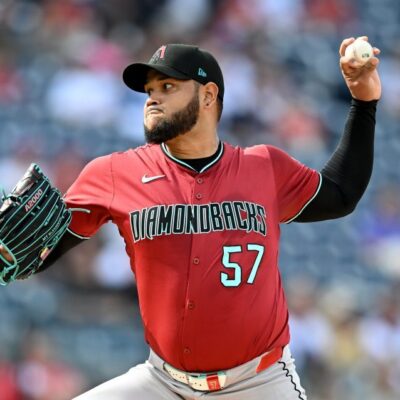
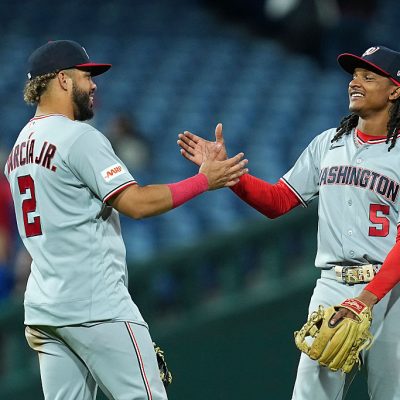
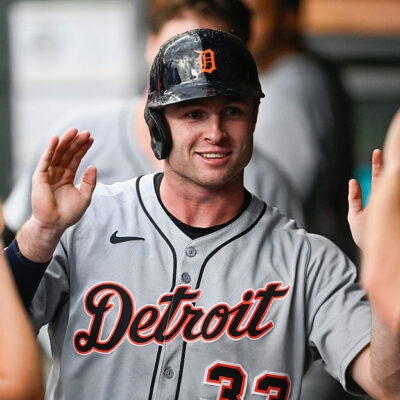
Why Tyler Anderson’s Strong Start Is Unsustainable

While he has some impressive surface-level numbers, Angels LHP Tyler Anderson has some advanced metrics that suggest a regression is inevitable.

PITTSBURGH, PA - MAY 06: Tyler Anderson #31 of the Los Angeles Angels pitches in the first inning against the Pittsburgh Pirates during inter-league play at PNC Park on May 6, 2024 in Pittsburgh, Pennsylvania. (Photo by Justin K. Aller/Getty Images)

Entering the 2024 campaign, the Los Angeles Angels lost Shohei Ohtani and it seemed that followers of the club would never know happiness again. While the team is 20-30 and falling further out of contention, this is not an organization devoid of positive stories.

One of the top developments out of Los Angeles has been the resurgence of Tyler Anderson. The southpaw is in the second year of a three-year contract he signed prior to the 2023 campaign and is looking a whole lot like his 2022 All-Star self.

Anderson, 34, has made 10 starts so far and sports a cool 2.52 ERA and 163 ERA+, both numbers besting his ’22 performance when he went 15-5 and had a 2.57 ERA with a 157 ERA+. He endured a down year last year and seemed to be on the decline, but his turnaround has been a welcomed story.

However, Anderson is a massive candidate to see his numbers come back down to earth. We don’t believe in calling his statistics “luck” based, but rather that they’re unsustainable over the course of the season. His 4.30 FIP, 4.61 xERA and 4.87 SIERA all bring up questions that will likely answer themselves over the course of the next few months.

Ad – content continues below

To put that into perspective before we go on, he’s got the largest gap in ERA-SIERA and ERA-xFIP among qualified pitchers, the second-largest gap in ERA-xERA and fifth-largest in ERA-FIP.

Let’s dive into Anderson’s under-the-hood metrics and see why he’s got one of MLB’s most unsustainable stat lines.

Tyler Anderson Is Due For a Regression

The fact that Anderson has been able to maintain an ERA in the mid-2.00s is very impressive, especially with the skillset he brings to the table. He is a part of a dying breed in today’s game, throwing a four-seam fastball that typically sits around 89 mph. Pitchers that fit this mold usually also have a heavy sinker in their arsenal that is used to induce groundballs as their main form of getting batters out. Anderson is not one of those.

He’s got a total of five pitches to play with, but his groundball rate is just 35.4%, which puts him in the 19th percentile. Not to mention, he also rarely strikes batters out (17.1 K% – 18th percentile), which gives him a rather unique makeup.

The main point of concern for him is the fact that he has not switched up his repertoire in years. Every pitch he throws this year is the exact same as it was last year when he was lit up like a Christmas tree. If anything, the velocity on his pitches has gone down, making it even more of an inevitability that he becomes more hittable as time passes by.

Anderson’s lack of velocity ultimately makes him more hittable. Pair this with the lack of groundballs and strikeouts, and it practically feels like a given that batters are going to catch on to his game sooner rather than later.

Ad – content continues below

That’s far from the only argument, though. There are a few additional factors playing into why I believe he’s got to return to “normal” at some point.

Hard-Hit Balls

Sitting in the 16th in Barrel %, it’s clear that batters are already hitting the ball very hard against Anderson. Yet, he remains largely unaffected by this. Again, without leaning too heavily on the “luck” word, this is a telltale sign that he’s been extremely lucky.

Last year, his Hard-Hit % sat at 32.3% when all was said and done. That was the mark he had in a season that was one of the worst he endured in many years. Right now, it sits at 36.5%. Keep in mind, Anderson has not changed anything notable in his setup or pitch mix. He’s virtually the exact same pitcher that he was in 2023.

Remember, his ERA is at 2.52, but the xERA and FIP are both well above 4.00. The fact that the opposition is squaring up his pitches at this high of a rate clarifies why that’s the case in a big way.

A look at some leaderboards shows that batters have achieved an exit velocity of 95 mph or more 70 times off of Anderson this year. That puts him in a tie for 18th in baseball. This has a lot more to do with the sheer amount of contact he allows than his hard-hit rate, as he is actually above league-average in hard-hit rate on the season.

BABIP

As of right now, Anderson’s Batting Average on Balls in Play is by far the lowest it’s ever been in his career, and this is despite the fact he has changed virtually nothing in his game. BABIP is best defined as a player’s batting average (or in this case, batting average against) strictly on balls hit into the field of play.

Ad – content continues below

Anderson’s currently sporting a BABIP of just .209, which somehow lands him in fourth place on the MLB-wide leaderboards. His previous lowest number in this category was .256 back in that 2022 season.

Typically, pitchers with low groundball rates tend to run BABIPs on the lower side, but Anderson’s is so low that it’s difficult to see how he could keep it that way, especially when looking at where he’s been at over the course of his career.

For a pitcher who allows as many barrels as he does, it truly is only a matter of time before all the hard contact and the ridiculous amount of fly balls end up falling for hits (and heading over the fence) rather than finding fielders’ gloves.

Since Anderson is allowing fly balls at over a 32% rate (after being at 33.9% last year), it seems that he’s simply keeping Taylor Ward (LF, 69th percentile in OAA), Mickey Moniak (CF, 64th) and Jo Adell (RF, 64th) busy while just barely keeping those fly balls in the park.

Runners in Scoring Position

One of the biggest spots Anderson has found success in is when runners are in scoring position. He’s allowed the opposition to hit just .167 in these situations with a .592 OPS. It seems that he’s given other teams ample opportunities to score off of him, but he’s able to prevent them from coming around.

It’s been established already that the left-hander is pretty much the exact same pitcher in 2024 that he was in 2023. Last year, hitters teed off with RISP, posting a .277 average and .898 OPS in 156 plate appearances. Even when he had his breakout in 2022, his opponents were hitting .222 with RISP. It’s difficult to see a way that he can maintain his current pace.

Ad – content continues below

Somehow, Anderson has yet to allow a single base hit this season with a runner solely on third base, with runners on first and third or with runners on second and third.

In most cases, pitchers who shut down the opposition with RISP are high-strikeout arms. As we’ve already covered, Anderson is pretty much the exact opposite of a “strikeout pitcher.” He allows more balls in play than your typical pitcher, and if his BABIP regresses toward his career average, a lot more of the contact he allows will result in runners reaching base. This doesn’t bode well for his strand rate, as more runners are going to come around to score if this pace continues.

Credit Where Credit Is Due

The fact of the matter is that Anderson is severely outperforming his advanced metrics and doing a damn good job of it. He’s got a lot of different metrics working against him, but he’s found a way to maintain a respectable mid-2.00s ERA and is truly one of the bright spots on an Angels team that doesn’t have many to speak of.

As of right now, the nine-year veteran is tied for eighth in the majors in LOB% and 12th in ERA. Even if it isn’t sustainable, it’s a nice storyline to follow along with.